Water Equity in California
June 2017
This quarter, I researched water equity in California under the guidance of Professor Jon Christensen. Water is an undeniably valuable resource, as it is necessary to sustain the health of populations as well as agricultural production- both of which are of critical importance in this state. California is the most populous state in the nation, with about 39 million people, while the Central Valley is known for is vast variety and volume of agricultural output. The high demand of water, as well as effects of California’s drought have affected both the accessibility and affordability of clean drinking water, especially harming the health and wellbeing of those in disadvantaged communities. I did my research on this issue, and how the state has and is addressing it. My research was divided into two parts: water equity legislation, and the spatial distribution of water contamination and disadvantaged communities.
I. Water Equity Legislation
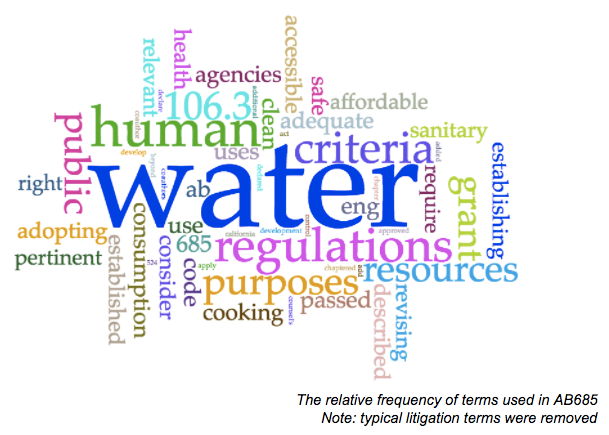
I based much of my research on water equity legislation around the California Assembly Bill 685. A depiction of the relative frequency of terms used in AB685 can be seen below. Please note that typical litigation terms (“state”, “shall”, “section”, “assembly”, “august”, “bill”, “senate”, “policy”, “policies”, “amended”, “board” , “department”, “including”, “september”, “subdivision”, “following”, “chapter”, “pursuant”, and “code”) were removed in order to see the patterns of water equity term usage more clearly. Passed in 2012, this bill stated that it is the “established policy of the state that every human being has the right to safe, clean, affordable, and accessible water adequate for human consumption”. I did research and a closer reading on this “right”, to see if the policy passed since has reflected and enforced the statements made in AB685.
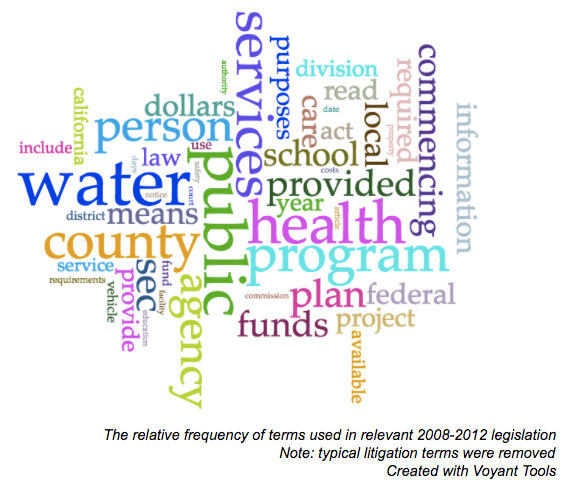
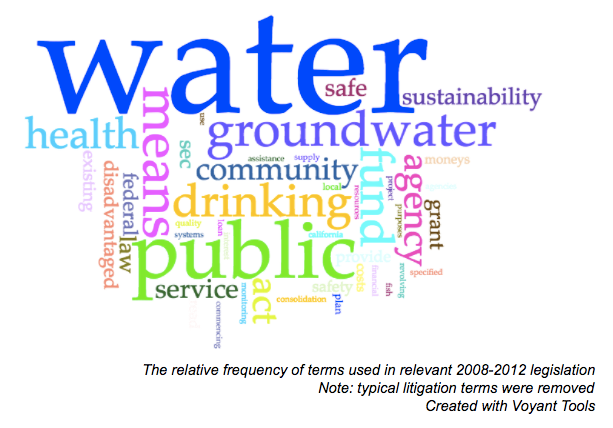
In order to analyze how California has been addressing water equity, I reviewed relevant legislation passed from 4 years before, and 4 years after AB685 was passed. The criteria I used for ‘relevant’ legislation were bills that mentioned both the phrases “drinking water” and “disadvantaged”. 17 relevant bills were passed between 2008 to 2012, while 14 were passed between 2012 and 2016. However, after a closer, individual reading of each bill, I only considered 9 of the 14 from 2012 to 2016 as relevant, because those that were section or budget amendments barely mentioned each phrase once, and were excluded. Ultimately, the relevant bills discussed a wide range of environmental equity topics, including: state grants and funds to provide safe drinking water to disadvantaged communities, community public water systems, infrastructure improvements, protection of public health and water quality, management of groundwater, sustainability plans, water recycling and treatment, the need to provide “nutritious beverages to students at schools, the duty of the State Department to regulate and conduct water-related research, and more. Below are two depictions showing the relative frequency of terms used in the legislation before and after 2012. Neither depictions include the terms from AB685. Please note that, again, typical litigation terms were removed so as not to obscure the pattern of water equity terms. As you can see, the legislation passed before AB685 emphasized “water” and “public” “health”. These main terms are prevalent in the bills passed after AB685, but we also start to see terms like “sustainability” and “disadvantaged” “community” come into play.
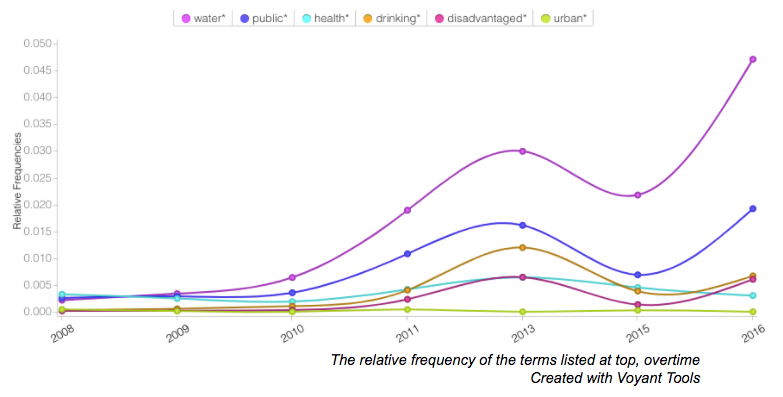
The second way I examined the legislation was by exploring the relative frequency of specific terms overtime. The water equity terms I chose to examine were “water”, “public”, “health”, drinking”, disadvantaged”, and “urban”. Below, you can see the usage and frequency of the words used by each year. It does not include the legislative text from AB685. The year 2014 is not listed because there were zero relevant bills passed that year. As illustrated by the graph, the usage of water equity terms, particularly “water”, “public”, “drinking”, and “disadvantaged”, has varied but ultimately increased overtime. One interesting trend to note is that while the passage of AB685 in 2012 marked an important upward shift in the concern of drinking water rights, the concern and usage of important terms had begun to increase even before then.
II. The Spatial Distribution of Water Contamination and Disadvantaged Communities
The second part of my research was looking at the spatial distribution of water contamination, and how it is used to inform legislation. Below is a map of the CalEnviroScreen 2.0 Water Contamination Data (data downloaded at https://oehha.ca.gov/calenviroscreen/drinking-water). This is the data currently being used by the Office of Environmental Health Hazard Assessment (OEHHA) to inform legislation. A higher drinking water score indicates higher amounts of water contamination, so the areas with the darkest red suffer from more highly contaminated water The scores were measured and assigned by census tract. As you can see, the areas that tend to suffer from higher levels of water contamination include much of the Central Valley, central California and inland California.
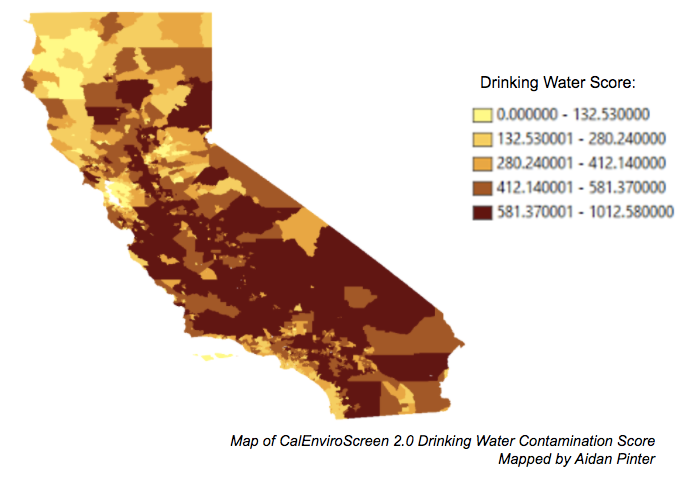
However, the issue with using this map and data to inform legislation is that the CalEnviroScreen 2.0 Final Report itself states that “the drinking water contaminant index [the Drinking Water Score] used in CalEnviroScreen 2.0 is not a measure of compliance with [state] standards… The indicator does not indicate whether water is safe to drink” (p.34 https://oehha.ca.gov/media/downloads/report/ces20finalreportupdateoct2014.pdf). So if the data here does not even indicate if water is safe to drink, why are we using it to inform legislation for equal access to safe drinking water?
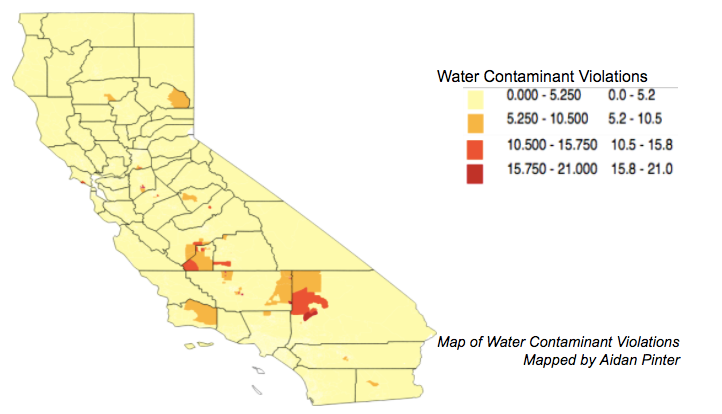
In order to come up with a better solution and depiction of the spatial distribution of state water contamination, I worked with and adjusted the CalEnviroScreen data. Instead of using the Drinking Water Score, I created a new measure of a census tract’s violations of water contamination- specifically Maximum Contaminant Level (MCL) and Total Coliform Rule (TCR) Violations. I chose contamination violations to represent the water contamination of an area because that means the water failed the comply with a state standard that was already previously set. The map with the adjusted data is below. A higher numerical value of Water Contaminant Violations indicates a higher frequency of violations.
Conclusion
Adjusting the data highlighted where water contamination violations are the most frequent. The two large census tracts in Southern California with higher violation frequencies are Kern and San Bernardino. This also made the map more clearly and effectively communicate which areas are more disadvantaged in terms of water equity, and serves as a recommendation of which areas should be highly prioritized by legislation.